Federal electoral district in British Columbia, Canada
Vancouver Centre British Columbia electoral district British Columbia electoral district |
|---|
 Location in Vancouver |
| Federal electoral district |
|---|
| Legislature | House of Commons |
|---|
| MP | Hedy Fry
Liberal |
|---|
| District created | 1914 |
|---|
| First contested | 1917 |
|---|
| Last contested | 2021 |
|---|
| District webpage | profile, map |
|---|
| Demographics |
|---|
| Population (2021)[1] | 126,995 |
|---|
| Electors (2021) | 91,276 |
|---|
| Area (km²)[2] | 11.20 |
|---|
| Pop. density (per km²) | 11,338.8 |
|---|
| Census division(s) | Metro Vancouver |
|---|
| Census subdivision(s) | Vancouver |
|---|
Vancouver Centre (French: Vancouver-Centre) is a federal electoral district in British Columbia, Canada, that has been represented in the House of Commons of Canada since 1917. It is the riding with the biggest Japanese community in Canada. As per the 2021 census, 2.4% of the population of Vancouver-Centre is Japanese.[3]
Geography
The riding includes the neighbourhoods of Yaletown, the West End, Coal Harbour, Downtown Vancouver, western Strathcona, eastern Kitsilano, and False Creek South. The heavily urbanized electoral district is by far the most densely populated in Western Canada, with most of its residents living in mid and high rise apartments. The riding has a diverse, multi-generational demographic.
Demographics
- According to the 2021 Canadian census
- Languages (2021 mother tongue) : 55.2% English, 4.8% Mandarin, 4.6% Iranian Persian, 4% Spanish, 2.9% Yue, 2.5% French, 2.5% Korean, 1.9% Russian, 1.8% Portuguese, 1.7% Japanese, 1% German[4]
Panethnic groups in Vancouver Centre (2011−2021) Panethnic
group | 2021[5] | 2016[6] | 2011[7] |
| Pop. | % | Pop. | % | Pop. | % |
| European[a] | 70,670 | 56.77% | 71,345 | 62.48% | 65,120 | 64.45% |
| East Asian[b] | 21,985 | 17.66% | 19,505 | 17.08% | 17,065 | 16.89% |
| Middle Eastern[c] | 8,455 | 6.79% | 6,680 | 5.85% | 5,765 | 5.71% |
| South Asian | 6,275 | 5.04% | 4,150 | 3.63% | 2,990 | 2.96% |
| Latin American | 5,650 | 4.54% | 3,460 | 3.03% | 2,605 | 2.58% |
| Southeast Asian[d] | 4,265 | 3.43% | 3,520 | 3.08% | 3,470 | 3.43% |
| Indigenous | 2,615 | 2.1% | 2,305 | 2.02% | 1,740 | 1.72% |
| African | 1,730 | 1.39% | 1,300 | 1.14% | 1,005 | 0.99% |
| Other[e] | 2,825 | 2.27% | 1,930 | 1.69% | 1,275 | 1.26% |
| Total responses | 124,475 | 98.02% | 114,190 | 98.07% | 101,040 | 98.59% |
| Total population | 126,995 | 100% | 116,443 | 100% | 102,480 | 100% |
Notes: Totals greater than 100% due to multiple origin responses.
Demographics based on 2012 Canadian federal electoral redistribution riding boundaries. |
History
The electoral district was created in 1914 from parts of Vancouver City riding.
Canada's longest-serving female member of Parliament (MP), Hedy Fry, has represented Vancouver Centre since 1993. Another high-profile MP was Kim Campbell, who served as Prime Minister for 132 days before being defeated by Fry.
The 2012 federal electoral boundaries redistribution concluded that the electoral boundaries of Vancouver Centre should be adjusted, and a modified electoral district of the same name will be contested in future elections.[8] The redefined Vancouver Centre loses a portion of its current territory from its southern end to the new district of Vancouver Granville. These new boundaries were legally defined in the 2013 representation order, which came into effect upon the call of the 42nd Canadian federal election, scheduled for October 2015.[9]
Historical boundaries
-
1914 representation order
-
1933 representation order
-
1947 representation order
-
1952 representation order
-
1966 representation order
-
1976 representation order
-
1987 representation order
-
1996 representation order
-
2003 representation order
-
2013 representation order
-
2023 representation order
Members of Parliament
This riding has elected the following members of Parliament:
Current member of Parliament
Its current member of Parliament is Hedy Fry, a former physician. She was first elected in 1993, and is a member of the Liberal Party of Canada.
Election results
Graphs are unavailable due to technical issues. There is more info on Phabricator and on MediaWiki.org. |
Graph of election results in Vancouver Centre (minor parties that never got 2% of the vote or didn't run consistently are omitted)
| 2021 Canadian federal election |
| Party | Candidate | Votes | % | ±% | Expenditures |
| | Liberal | Hedy Fry | 20,873 | 40.44 | −1.74 | $87,773.26 |
| | New Democratic | Breen Ouellette | 15,869 | 30.74 | +7.00 | $80,950.83 |
| | Conservative | Harry Cockell | 11,162 | 21.62 | +2.35 | $20,505.00 |
| | Green | Alaric Paivarinta | 2,030 | 3.93 | −8.59 | $8,967.42 |
| | People's | Taylor Singleton-Fookes | 1,683 | 3.27 | +1.98 | $3,574.44 |
| Total valid votes/expense limit | 51,617 | 99.19 | – | $119,443.50 |
| Total rejected ballots | 422 | 0.81 | +0.16 |
| Turnout | 52,039 | 57.01 | −4.04 |
| Eligible voters | 91,276 |
| | Liberal hold | Swing | −4.37 |
| Source: Elections Canada[11][12] |
| 2019 Canadian federal election |
| Party | Candidate | Votes | % | ±% | Expenditures |
| | Liberal | Hedy Fry | 23,599 | 42.18 | −13.90 | $90,613.92 |
| | New Democratic | Breen Ouellette | 13,280 | 23.74 | +3.72 | $35,726.92 |
| | Conservative | David Cavey | 10,782 | 19.27 | +2.36 | $32,539.03 |
| | Green | Jesse Brown | 7,002 | 12.52 | +6.71 | $28,503.30 |
| | People's | Louise Kierans | 724 | 1.29 | – | $4,907.84 |
| | Libertarian | John Clarke | 379 | 0.68 | −0.38 | $0.00 |
| | Independent | Lily Bowman | 142 | 0.25 | – | none listed |
| | Independent | Imtiaz Popat | 38 | 0.07 | – | $0.00 |
| Total valid votes/expense limit | 55,946 | 99.35 |
| Total rejected ballots | 364 | 0.65 | +0.22 |
| Turnout | 56,310 | 61.05 | −4.85 |
| Eligible voters | 92,243 |
| | Liberal hold | Swing | −8.81 |
| Source: Elections Canada[13][14] |
| 2015 Canadian federal election |
| Party | Candidate | Votes | % | ±% | Expenditures |
| | Liberal | Hedy Fry | 32,554 | 56.08 | +25.06 | $126,090.21 |
| | New Democratic | Constance Barnes | 11,618 | 20.01 | −6.34 | $102,184.82 |
| | Conservative | Elaine Allan | 9,818 | 16.91 | −9.14 | $84,492.99 |
| | Green | Lisa Barrett | 3,370 | 5.81 | −9.27 | $45,728.01 |
| | Libertarian | John Clarke | 614 | 1.06 | +0.53 | – |
| | Marxist–Leninist | Michael Hill | 74 | 0.13 | +0.02 | – |
| Total valid votes/expense limit | 58,048 | 99.58 | | $224,575.59 |
| Total rejected ballots | 247 | 0.42 | – |
| Turnout | 58,295 | 65.89 | – |
| Eligible voters | 88,470 |
| | Liberal hold | Swing | +15.70 |
| Source: Elections Canada[15][16] |
| 2008 Canadian federal election: Vancouver Centre |
| Party | Candidate | Votes | % | ±% | Expenditures |
| | Liberal | Hedy Fry | 19,506 | 34.50 | −9.37 | $80,974 |
| | Conservative | Lorne Mayencourt | 14,188 | 25.09 | +4.73 | $91,239 |
| | New Democratic | Michael Byers | 12,047 | 21.31 | −7.34 | $85,957 |
| | Green | Adriane Carr | 10,354 | 18.31 | +12.43 | $82,713 |
| | Libertarian | John Clarke | 340 | 0.60 | +0.07 | $0 |
| | Marxist–Leninist | Michael Hill | 94 | 0.16 |
| Total valid votes/expense limit | 56,529 | 100.0 | | $94,404 |
| | Liberal hold | Swing | −7.05 |
| 2006 Canadian federal election |
| Party | Candidate | Votes | % | ±% | Expenditures |
| | Liberal | Hedy Fry | 25,013 | 43.80 | +3.50 | $77,826 |
| | New Democratic | Svend Robinson | 16,374 | 28.67 | −3.62 | $84,170 |
| | Conservative | Tony Fogarassy | 11,684 | 20.46 | +1.26 | $86,591 |
| | Green | Jared Evans | 3,340 | 5.84 | −0.94 | $1,008 |
| | Libertarian | John Clarke | 304 | 0.53 | −0.04 | |
| | Marijuana | HeathCliff Dion Campbell | 259 | 0.45 | – | $115 |
| | Christian Heritage | Joe Pal | 130 | 0.22 | −0.24 | $389 |
| Total valid votes | 57,104 | 100.0 |
| Total rejected ballots | 163 | 0.28 | −0.15 |
| Turnout | 57,267 | 62.06 | +0.59 |
| | Liberal hold | Swing | +3.56 |
| 2004 Canadian federal election |
| Party | Candidate | Votes | % | ±% | Expenditures |
| | Liberal | Hedy Fry | 21,280 | 40.30 | −2.00 | $66,619 |
| | New Democratic | Kennedy Stewart | 17,050 | 32.29 | +20.25 | $57,675 |
| | Conservative | Gary Mitchell | 10,139 | 19.20 | −18.70 | $73,789 |
| | Green | Robbie Mattu | 3,580 | 6.78 | +2.85 | $2,440 |
| | Libertarian | John Clarke | 304 | 0.57 | – | $60 |
| | Christian Heritage | Joe Pal | 243 | 0.46 | – | $389 |
| | Canadian Action | Alexander Frei | 101 | 0.19 | −1.08 | $100 |
| | Communist | Kimball Cariou | 96 | 0.18 | +0.01 | $389 |
| Total valid votes | 52,793 | 100.0 |
| Total rejected ballots | 226 | 0.43 | −0.05 |
| Turnout | 53,019 | 61.47 | 0.97 |
| | Liberal hold | Swing | −11.12 |
| Change for the Conservatives is based on the combined totals of the Canadian Alliance and the Progressive Conservatives. |
| 2000 Canadian federal election: Vancouver Centre |
| Party | Candidate | Votes | % | ±% | Expenditures |
| | Liberal | Hedy Fry | 24,553 | 42.30 | +1.54 | $69,017 |
| | Alliance | John Mortimer | 15,176 | 26.14 | +3.56 | $68,158 |
| | New Democratic | Scott Robertson | 6,993 | 12.04 | −8.83 | $8,841 |
| | Progressive Conservative | Lee Johnson | 6,828 | 11.76 | +2.52 | $4,047 |
| | Green | Jamie Lee Hamilton | 2,285 | 3.93 | +0.93 | $3,945 |
| | Marijuana | Marc Emery | 1,116 | 1.92 | – | |
| | Canadian Action | Jeff Jewell | 742 | 1.27 | +0.24 | $547 |
| | Natural Law | Valerie Laporte | 177 | 0.30 | −0.12 | $40 |
| | Communist | Kimball Cariou | 99 | 0.17 | – | $189 |
| | Marxist–Leninist | Joseph Theriault | 75 | 0.12 | −0.10 | $364 |
| Total valid votes | 58,044 | 100.0 |
| Total rejected ballots | 280 | 0.48 | −0.05 |
| Turnout | 58,324 | 60.50 | −4.22 |
| | Liberal hold | Swing | −1.01 |
| Change for the Canadian Alliance is based on the Reform Party. |
| 1997 Canadian federal election: Vancouver Centre |
| Party | Candidate | Votes | % | ±% | Expenditures |
| | Liberal | Hedy Fry | 20,878 | 40.76 | +9.57 | $54,905 |
| | Reform | Richard Farbridge | 11,567 | 22.58 | +5.12 | $24,846 |
| | New Democratic | Bill Siksay | 10,690 | 20.87 | +5.69 | $27,133 |
| | Progressive Conservative | Victoria Minnes | 4,736 | 9.24 | −15.81 | $43,121 |
| | Green | Paul Alexander | 1,541 | 3.00 | +2.05 | $2,154 |
| | Independent | Joseph Roberts | 728 | 1.42 | – | $6,163 |
| | Canadian Action | Connie Fogal | 528 | 1.03 | – | $12,986 |
| | Natural Law | John Cowhig | 217 | 0.42 | −0.62 | |
| | Independent | John Clarke | 125 | 0.24 | – | $2,687 |
| | Marxist–Leninist | Joseph Theriault | 116 | 0.22 | – | $559 |
| | Independent | Elvis Flostrand | 92 | 0.17 | – | $699 |
| Total valid votes | 51,218 | 100.0 |
| Total rejected ballots | 272 | 0.53 |
| Turnout | 51,490 | 64.72 |
| | Liberal hold | Swing | +2.22 |
Student vote results
2019
See also
Notes
- ^ Statistic includes all persons that did not make up part of a visible minority or an indigenous identity.
- ^ Statistic includes total responses of "Chinese", "Korean", and "Japanese" under visible minority section on census.
- ^ Statistic includes total responses of "West Asian" and "Arab" under visible minority section on census.
- ^ Statistic includes total responses of "Filipino" and "Southeast Asian" under visible minority section on census.
- ^ Statistic includes total responses of "Visible minority, n.i.e." and "Multiple visible minorities" under visible minority section on census.
- ^ Indicates what the riding results would have been had the 2021 election taken place using the updated riding boundaries from the 2022 Canadian federal electoral redistribution
- ^ Indicates what the riding results would have been had the 2011 election taken place using the updated riding boundaries from the 2012 Canadian federal electoral redistribution
References
- "Vancouver Centre (federal electoral district) (Code 59029) Census Profile". 2011 census. Government of Canada - Statistics Canada. Retrieved March 6, 2011.
- ^ Statistics Canada: 2022
- ^ Statistics Canada: 2022
- ^ "Census Profile, 2021 Census, Statistics Canada - Validation Error".
- ^ "Mother Tongue for the Population Excluding Institutional Residents of Canada, Provinces and Territories and Federal Electoral Districts (2013 Representation Order), 2021 Census". December 15, 2022.
- ^ Government of Canada, Statistics Canada (October 26, 2022). "Census Profile, 2021 Census of Population". www12.statcan.gc.ca. Retrieved February 16, 2023.
- ^ Government of Canada, Statistics Canada (October 27, 2021). "Census Profile, 2016 Census". www12.statcan.gc.ca. Retrieved February 16, 2023.
- ^ Government of Canada, Statistics Canada (November 27, 2015). "NHS Profile". www12.statcan.gc.ca. Retrieved February 16, 2023.
- ^ Final Report – British Columbia
- ^ Timeline for the Redistribution of Federal Electoral Districts
- ^ "Transposition of Votes from the 44th General Election to the 2023 Representation Orders". Elections Canada. Retrieved April 9, 2024.
- ^ "Confirmed candidates — Vancouver Centre". Elections Canada. September 1, 2021. Retrieved September 6, 2021.
- ^ "Candidate Campaign Returns". Elections Canada. Retrieved July 19, 2022.
- ^ "List of confirmed candidates". Elections Canada. Retrieved October 4, 2019.
- ^ "Official Voting Results". Elections Canada. Retrieved August 8, 2021.
- ^ Elections Canada – Confirmed candidates for Vancouver Centre, 30 September 2015
- ^ Elections Canada – Preliminary Election Expenses Limits for Candidates
- ^ Pundits' Guide to Canadian Elections
- ^ Vancouver Sun, June 26, 1968, "Republicans Claim Win", p. 15
- ^ "List of confirmed candidates". Elections Canada. Retrieved October 4, 2019.
- ^ "Official Voting Results". Student Vote Canada. Retrieved August 27, 2021.
External links
- Expenditures – 2004
- Expenditures – 2000
- Expenditures – 1997
- Vancouver Centre electoral information at the Library of Parliament
- Website of the Parliament of Canada
- Map of Vancouver Center from Elections Canada. (PDF)
- Vancouver Centre electoral District Profile, Elections Canada
- Conservative Party of Canada - Vancouver Centre Electoral District Association
- Green Party of Canada - Vancouver Centre Electoral District Association
| Parliament of Canada |
| Preceded by Charlevoix | Constituency represented by the prime minister
1993 | Succeeded by Saint-Maurice |
49°17′N 123°07′W / 49.28°N 123.12°W / 49.28; -123.12
 British Columbia electoral district
 1914 representation order
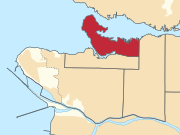 1933 representation order
 1947 representation order
 1952 representation order
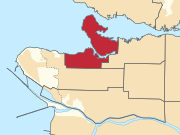 1966 representation order
 1976 representation order
 1987 representation order
 1996 representation order
 2003 representation order
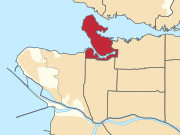 2013 representation order
 2023 representation order


