Local government elections in West Sussex, England
Half of Adur District Council in West Sussex, England is elected every two years. Until 2003, the council was elected by thirds. Since the last boundary changes in 2004, 29 councillors have been elected from 14 wards.[1]
Council elections
District result maps
-
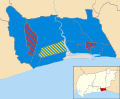
2004 results map
-
2006 results map
-
2008 results map
-
2010 results map
-
2012 results map
-
2014 results map
-
2016 results map
-
2018 results map
-
2021 results map
-
2022 results map
By-election results
1994-1998
Cokeham By-Election 1 May 1997 | Party | Candidate | Votes | % | ±% |
| | Liberal Democrats | | 967 | 37.5 | −2.4 |
| | Labour | | 821 | 31.8 | −14.9 |
| | Conservative | | 790 | 30.6 | +17.2 |
| Majority | 146 | 5.7 | |
| Turnout | 2,578 | | |
| | Liberal Democrats hold | Swing | | |
Southwick Green By-Election 1 May 1997 | Party | Candidate | Votes | % | ±% |
| | Liberal Democrats | | 1,066 | 38.3 | −20.5 |
| | Conservative | | 1,062 | 38.2 | +15.5 |
| | Labour | | 652 | 23.5 | +4.9 |
| Majority | 4 | 0.1 | |
| Turnout | 2,780 | | |
| | Liberal Democrats hold | Swing | | |
Widewater By-Election 1 May 1997 | Party | Candidate | Votes | % | ±% |
| | Conservative | | 1,192 | 39.3 | +7.6 |
| | Liberal Democrats | | 924 | 30.5 | −7.2 |
| | Labour | | 916 | 30.2 | −0.4 |
| Majority | 268 | 8.8 | |
| Turnout | 3,032 | | |
| | Conservative gain from Liberal Democrats | Swing | | |
1998-2002
Peverel By-Election 2 July 1998 | Party | Candidate | Votes | % | ±% |
| | Conservative | | 425 | 35.6 | −4.5 |
| | Liberal Democrats | | 423 | 35.4 | −10.1 |
| | Labour | | 346 | 29.0 | +14.7 |
| Majority | 2 | 0.2 | |
| Turnout | 1,194 | | |
| | Conservative gain from Liberal Democrats | Swing | | |
Widewater By-Election 24 June 1999 | Party | Candidate | Votes | % | ±% |
| | Conservative | | 738 | 50.3 | +10.4 |
| | Labour | | 589 | 40.2 | −4.7 |
| | Liberal Democrats | | 139 | 9.5 | −5.7 |
| Majority | 149 | 10.1 | |
| Turnout | 1,466 | 34.6 | |
| | Conservative gain from Labour | Swing | | |
Manor By-Election 7 June 2001 | Party | Candidate | Votes | % | ±% |
| | Conservative | Angela Mills | 886 | 41.9 | +3.1 |
| | Liberal Democrats | Shirely Rance | 802 | 38.0 | −10.9 |
| | Labour | Ronald Horne | 425 | 21.1 | −7.8 |
| Majority | 84 | 3.9 | |
| Turnout | 2,113 | 64.0 | |
| | Conservative gain from Liberal Democrats | Swing | | |
Peverel By-Election 7 June 2001 | Party | Candidate | Votes | % | ±% |
| | Conservative | Andrew McGregor | 761 | 40.0 | −1.5 |
| | Liberal Democrats | Barrie Marler | 617 | 32.4 | +2.7 |
| | Labour | Jeanette White | 525 | 27.6 | −1.2 |
| Majority | 144 | 7.6 | |
| Turnout | 1,903 | 60.7 | |
| | Conservative gain from Liberal Democrats | Swing | | |
Southwick Green By-Election 7 June 2001 | Party | Candidate | Votes | % | ±% |
| | Conservative | Iris Hayward | 895 | 38.9 | −0.6 |
| | Liberal Democrats | Anthony Stuart | 720 | 31.3 | −1.3 |
| | Labour | Teana Ashley | 686 | 29.8 | +2.0 |
| Majority | 175 | 7.6 | |
| Turnout | 2,301 | 61.1 | |
| | Conservative gain from Labour | Swing | | |
2002-2006
Churchill By-Election 20 February 2003 | Party | Candidate | Votes | % | ±% |
| | Conservative | Sara Hall | 368 | 50.5 | −5.9 |
| | Liberal Democrats | Roy Gibson | 213 | 29.2 | +29.2 |
| | Labour | Ann Bridges | 148 | 20.3 | −12.4 |
| Majority | 155 | 21.3 | |
| Turnout | 729 | 18.8 | |
| | Conservative hold | Swing | | |
Marine By-Election 5 May 2005[7] | Party | Candidate | Votes | % | ±% |
| | Independent | Keith Fayers-Morrisey | 1,190 | 62.3 | |
| | Liberal Democrats | Doris Martin | 404 | 21.2 | |
| | Labour | Daniel Yates | 316 | 16.5 | |
| Majority | 786 | 41.1 | |
| Turnout | 1,910 | 64.0 | |
| | Independent hold | Swing | | |
2006-2010
Hillside By-Election 14 September 2006[8] | Party | Candidate | Votes | % | ±% |
| | Conservative | Angus Dunn | 445 | 59.1 | −0.2 |
| | Liberal Democrats | Clive Connor | 184 | 24.4 | +2.7 |
| | Labour | Barry Thompson | 124 | 16.5 | −2.5 |
| Majority | 261 | 34.7 | |
| Turnout | 753 | 22.0 | |
| | Conservative hold | Swing | | |
2010-2014
Cokeham By-Election, 18 October 2011[9] | Party | Candidate | Votes | % | ±% |
| | Conservative | Nicholas Pigott | 288 | 39.6 | −15.6 |
| | Labour | Barry Mear | 282 | 38.8 | +13.6 |
| | UKIP | David Bamber | 91 | 12.5 | +12.5 |
| | Green | Jennie Tindall | 35 | 4.8 | +4.8 |
| | Liberal Democrats | Cyril Cannings | 31 | 4.3 | −15.3 |
| Majority | 6 | 0.8 | −29.2 |
| Turnout | 730 | 21.4 | −9.6 |
| | Conservative hold | Swing | -14.6 | |
Southlands By-Election, 2 May 2013[10] | Party | Candidate | Votes | % | ±% |
| | UKIP | Paul Graysmark | 354 | 39.9 | +24.8 |
| | Labour | Andy Bray | 254 | 28.6 | −8.5 |
| | Conservative | Vicky Parkin | 228 | 25.7 | −12.3 |
| | Liberal Democrats | Cyril Cannings | 51 | 5.7 | −4.1 |
| Majority | 100 | 11.3 | |
| Turnout | 887 | | |
| | UKIP gain from Conservative | Swing | | |
Paul Graysmark was elected in 2012 for the Conservatives; he resigned to seek re-election as a UKIP candidate.
2014-2018
St Mary's By-Election, 5 December 2014[11] | Party | Candidate | Votes | % | ±% |
| | Conservative | Stephen Chipp | 340 | 38.4 | +1.3 |
| | Labour | Irene Reed | 223 | 25.2 | +2.6 |
| | UKIP | Jenny Greig | 216 | 24.4 | +3.3 |
| | Green | Jennie Tindall | 106 | 12.0 | −0.7 |
| Majority | 117 | 13.2 | |
| Turnout | 885 | | |
| | Conservative hold | Swing | | |
Mash Barn By-Election, 5 October 2017[12] | Party | Candidate | Votes | % | ±% |
| | Labour | Lee Cowen | 490 | 49.3 | +29.7 |
| | Conservative | Jack Howard | 384 | 38.6 | +16.0 |
| | Liberal Democrats | Doris Martin | 89 | 9.0 | −6.5 |
| | Green | Paul Hendy | 31 | 3.1 | +3.1 |
| Majority | 106 | 10.7 | |
| Turnout | 994 | | |
| | Labour gain from UKIP | Swing | | |
2018-2022
Southlands By-Election, 11 October 2018[13] | Party | Candidate | Votes | % | ±% |
| | Labour | Debs Stainforth | 448 | 45.9 | +4.1 |
| | Green | Andrew Bradbury | 395 | 40.5 | +34.9 |
| | Conservative | Tony Nicklen | 132 | 13.5 | −27.2 |
| Majority | 53 | 5.4 | |
| Turnout | 975 | | |
| | Labour gain from UKIP | Swing | | |
Hillside By-Election, 2 December 2021[14] | Party | Candidate | Votes | % | ±% |
| | Conservative | Leila Williams | 414 | 56.2 | |
| | Green | Russell Whiting | 175 | 23.7 | |
| | Labour | Rebecca Allinson | 148 | 20.1 | |
| Majority | 239 | 32.4 | |
| Turnout | 737 | | |
| | Conservative hold | Swing | | |
References
- ^ "Your councillors". Adur District Council. Retrieved 21 October 2009.
- ^ The District of Adur (Electoral Arrangements) Order 1978
- ^ The Adur, Arun and Worthing (Areas) Order 1985
- ^ legislation.gov.uk - The East Sussex, West Sussex and Kent (County Boundaries) Order 1992. Retrieved on 5 November 2015.
- ^ "Adur". * BBC News Online. Retrieved 3 May 2008.
- ^ legislation.gov.uk - The District of Adur (Electoral Changes) Order 2002. Retrieved on 4 October 2015.
- ^ "Marine ward by-election" (PDF). Adur District Council. Retrieved 26 July 2011.
- ^ "Welsh council victory for Labour". guardian.co.uk. 15 September 2006. Retrieved 21 October 2009.
- ^ "Declaration of Result: Cokeham Ward By Election" (PDF). Adur District Council. 18 October 2011. Retrieved 19 October 2011.
- ^ "Local Elections Archive Project — Southlands Ward". www.andrewteale.me.uk. Retrieved 21 April 2022.
- ^ "Local Elections Archive Project — St Mary's Ward". www.andrewteale.me.uk. Retrieved 21 April 2022.
- ^ "Local Elections Archive Project — Mash Barn Ward". www.andrewteale.me.uk. Retrieved 21 April 2022.
- ^ "Local Elections Archive Project — Southlands Ward". www.andrewteale.me.uk. Retrieved 21 April 2022.
- ^ "Local Elections Archive Project — Hillside Ward". www.andrewteale.me.uk. Retrieved 21 April 2022.
External links
 2004 results map
 2006 results map
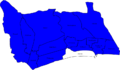 2008 results map
 2010 results map
 2012 results map
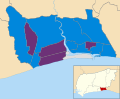 2014 results map
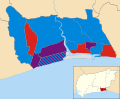 2016 results map
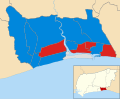 2018 results map
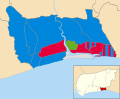 2021 results map
 2022 results map


 Council elections in West Sussex


