Part of the 1991 Irish local elections
1991 Westmeath County Council election
|
|
All 23 seats to Westmeath County Council |
|---|
| | First party | Second party | Third party | | | | | | | Party | Fianna Fáil | Fine Gael | Labour | | Seats won | 12 | 6 | 4 | | Seat change | -1 | +1 | +1 |
| | | Fourth party | | | | | | | Party | Independent | | | Seats won | 1 | | | Seat change | -1 | | |
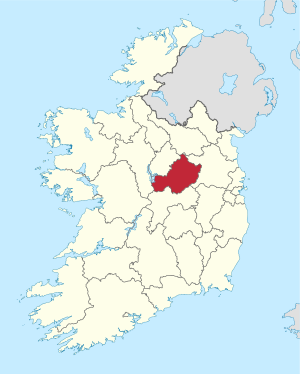 Map showing the area of Westmeath County Council |
Council control before election
Fianna Fáil
| Council control after election
Fianna Fáil
| |
An election to Westmeath County Council took place on 27 June 1991 as part of that year's Irish local elections. 23 councillors were elected from five local electoral areas (LEAs) for a five-year term of office on the electoral system of proportional representation by means of the single transferable vote (PR-STV). This term was extended twice, first to 1998, then to 1999.[1][2]
Results by party
| Party | Seats | ± | First Pref. votes | FPv% | ±% |
| | Fianna Fáil | 12 | -1 | 12,247 | 44.26 | |
| | Fine Gael | 6 | +1 | 7,561 | 27.33 | |
| | Labour | 4 | +1 | 5,063 | 18.30 | |
| | Independent | 1 | -1 | 2,415 | 8.70 | |
| Totals | 23 | - | 27,670 | 100.00 | — |
Results by local electoral area
Athlone
Athlone - 7 seats | Party | Candidate | FPv% | Count |
| 1 | 2 | 3 | 4 | 5 | 6 | 7 | 8 | 9 | 10 | 11 | 12 | 13 | 14 | 15 | 16 |
| | Fianna Fáil | Senator Seán Fallon* | 13% | 1,140 | | | | | | | | | | | | | | | |
| | Fine Gael | Brendan McFadden* | 9.3% | 817 | 821 | 831 | 839 | 860 | 906 | 962 | 988 | 1,064 | 1,070 | 1,180 | | | | | |
| | Fianna Fáil | P.J. Coghill* | 8.4% | 737 | 740 | 742 | 746 | 753 | 758 | 762 | 764 | 834 | 882 | 896 | 897 | 912 | 932 | 940 | 981 |
| | Independent | Stephen Price* | 7.9% | 693 | 694 | 713 | 719 | 729 | 736 | 742 | 778 | 792 | 931 | 952 | 956 | 1,009 | 1,228 | | |
| | Fianna Fáil | Kieran Molloy | 7.5% | 660 | 668 | 671 | 684 | 701 | 707 | 734 | 766 | 774 | 812 | 846 | 857 | 943 | 959 | 966 | 1,033 |
| | Fianna Fáil | Kieran Temple* | 6.5% | 575 | 582 | 583 | 590 | 600 | 621 | 629 | 641 | 647 | 672 | 712 | 729 | 764 | 774 | 782 | 826 |
| | Fianna Fáil | Egbert Moran | 5.3% | 463 | 467 | 469 | 477 | 480 | 510 | 517 | 522 | 531 | 591 | 643 | 648 | 662 | 675 | 680 | 782 |
| | Fine Gael | George Allen* | 4.7% | 415 | 416 | 423 | 424 | 435 | 477 | 480 | 484 | 537 | 581 | 636 | 652 | 664 | 837 | 895 | 998 |
| | Fianna Fáil | George Ledwidth* | 4.5% | 399 | 401 | 407 | 408 | 414 | 416 | 419 | 425 | 432 | | | | | | | |
| | Fine Gael | Pauline Coghlan | 4.3% | 381 | 382 | 392 | 393 | 394 | 417 | 417 | 422 | 486 | 525 | 545 | 558 | 567 | | | |
| | Labour | John Henson | 4.3% | 377 | 379 | 400 | 410 | 427 | 441 | 507 | 533 | 555 | 563 | 587 | 594 | 646 | 670 | 673 | |
| | Progressive Democrats | Des Lynch | 4.1% | 364 | 365 | 367 | 372 | 377 | 402 | 412 | 425 | 437 | 445 | | | | | | |
| | Fine Gael | Vincent Dooley | 3.8% | 332 | 333 | 336 | 337 | 352 | 367 | 371 | 379 | | | | | | | | |
| | Independent | Patsy Beaumont | 2.9% | 255 | 257 | 263 | 282 | 327 | 330 | 363 | 450 | 460 | 462 | 484 | 491 | | | | |
| | Fine Gael | Dick O'Brien | 2.7% | 241 | 243 | 244 | 246 | | | | | | | | | | | | |
| | Independent | Austin Berry | 2.7% | 234 | 235 | 245 | 285 | 321 | 324 | 337 | | | | | | | | | |
| | Labour | John Keenehan | 2.6% | 230 | 231 | 237 | 244 | 250 | 250 | | | | | | | | | | |
| | Independent | Oliver Gavin | 2.4% | 209 | 210 | 217 | 226 | | | | | | | | | | | | |
| | Independent | John Kearney | 1.6% | 144 | 145 | 147 | | | | | | | | | | | | | |
| | Labour | David Dolan | 0.9% | 82 | 82 | | | | | | | | | | | | | | |
| | Independent | Benny Cooney | 0.5% | 43 | 43 | | | | | | | | | | | | | | |
| Electorate: 15,813 Valid: 8,790 (55.59%) Spoilt: 71 Quota: 1,099 Turnout: 8,861 (56.04%) |
Coole
Coole - 4 seats | Party | Candidate | FPv% | Count |
| 1 | 2 | 3 | 4 | 5 | 6 | 7 |
| | Fianna Fáil | Senator Donie Cassidy* | 18.3% | 897 | 921 | 933 | 1,021 | | | |
| | Fianna Fáil | P.J. O'Shaughnessy* | 14.7% | 720 | 725 | 731 | 816 | 857 | 880 | 1,000 |
| | Fianna Fáil | Thomas Bourke* | 12.8% | 628 | 630 | 714 | 753 | 768 | 870 | 878 |
| | Fine Gael | Frank McDermott* | 12.1% | 594 | 617 | 644 | 702 | 728 | 764 | 1,007 |
| | Fine Gael | Phil Brennan | 10.3% | 504 | 507 | 561 | 578 | 580 | 672 | 748 |
| | Fine Gael | Maura Drum | 8.7% | 429 | 435 | 443 | 466 | 470 | 493 | |
| | Labour | Johnnie Penrose | 7.8% | 381 | 421 | 463 | 469 | 470 | | |
| | Fianna Fáil | Molly Cahill | 7.6% | 372 | 385 | 391 | | | | |
| | Independent | Kevin Boyhan | 5.2% | 255 | 258 | | | | | |
| | Labour | Johnny McCormack | 2.5% | 125 | | | | | | |
| Electorate: 7,178 Valid: 4,905 (68.33%) Spoilt: 45 Quota: 982 Turnout: 4,950 (68.96%) |
Kilbeggan
Kilbeggan - 4 seats | Party | Candidate | FPv% | Count |
| 1 | 2 | 3 | 4 | 5 | 6 | 7 |
| | Fine Gael | Joe Flanagan* | 23.2% | 1,124 | | | | | | |
| | Fianna Fáil | Tom Cowley | 17.3% | 837 | 841 | 925 | 942 | 1,163 | | |
| | Labour | Mark Nugent* | 16.9% | 820 | 832 | 874 | 954 | 1,188 | | |
| | Fianna Fáil | Michael Ryan* | 13.6% | 659 | 705 | 718 | 724 | 815 | 866 | 1,043 |
| | Fianna Fáil | Christo Bradley | 10.9% | 529 | 536 | 547 | 593 | | | |
| | Fine Gael | Mary Fallon | 7% | 340 | 397 | 440 | 630 | 644 | 678 | 682 |
| | Fine Gael | Mary Henry | 7% | 321 | 345 | 360 | | | | |
| | Fine Gael | Gerald Cooney | 4.5% | 218 | 222 | | | | | |
| Electorate: 7,331 Valid: 4,848 (66.13%) Spoilt: 54 Quota: 970 Turnout: 4,902 (66.87%) |
Mullingar Lough Owel
Mullingar Lough Owel - 4 seats | Party | Candidate | FPv% | Count |
| 1 | 2 | 3 | 4 | 5 | 6 | 7 |
| | Labour | Willie Penrose* | 24.1% | 1,170 | | | | | | |
| | Fianna Fáil | Henry Abbott* | 22.6% | 1,101 | | | | | | |
| | Fine Gael | John Keegan | 16.9% | 821 | 854 | 864 | 909 | 978 | | |
| | Fianna Fáil | Tommy Wright | 12.1% | 587 | 619 | 654 | 689 | 700 | 700 | 1,043 |
| | Fianna Fáil | Shay Callaghan* | 9.1% | 444 | 470 | 527 | 568 | 574 | 574 | |
| | Fine Gael | Frank Wallace | 7.6% | 371 | 424 | 440 | 455 | 574 | 579 | 624 |
| | Fine Gael | Tommy Moughty | 4.3% | 210 | 239 | 243 | 247 | | | |
| | Independent | Robert Bagnall | 3.3% | 160 | 184 | 190 | | | | |
| Electorate: 8,054 Valid: 4,864 (60.39%) Spoilt: 40 Quota: 973 Turnout: 4,904 (60.89%) |
Mullingar Urban
Mullingar Urban - 4 seats | Party | Candidate | FPv% | Count |
| 1 | 2 | 3 | 4 | 5 | 6 | 7 | 8 |
| | Labour | Mick Dollard* | 39.6% | 1,688 | | | | | | | |
| | Fianna Fáil | Camillus Glynn* | 14.1% | 603 | 674 | 674 | 679 | 700 | 714 | 764 | 874 |
| | Fine Gael | Paul McGrath TD | 12.1% | 517 | 578 | 578 | 579 | 615 | 695 | 747 | 836 |
| | Fianna Fáil | Martin Hynes* | 11.8% | 501 | 553 | 554 | 555 | 565 | 576 | 623 | 719 |
| | Fianna Fáil | Jim Bourke | 6.5% | 275 | 304 | 304 | 304 | 328 | 349 | 372 | |
| | Labour | Des Coleman* | 4.5% | 190 | 678 | 679 | 689 | 710 | 732 | 810 | 845 |
| | Independent | Frank McIntyre* | 4.3% | 183 | 266 | 268 | 272 | 290 | 307 | | |
| | Fine Gael | Jim Guinan | 3.4% | 144 | 160 | 161 | 164 | 177 | | | |
| | Progressive Democrats | Pat Whelan | 3.3% | 141 | 160 | 160 | 163 | | | | |
| | Workers' Party | Patrick Boyce | 0.4% | 19 | 30 | 31 | | | | | |
| | Independent | Benedict Cooney | 0% | 2 | 7 | | | | | | |
| Electorate: 11,119 Valid: 5,731 (51.54%) Spoilt: 78 Quota: 956 Turnout: 5,809 (52.24%) |
References
- ^ Local Government Act 1994, s. 20: Year of elections to all local authorities (No. 8 of 1994, s. 20). Enacted on 29 April 1994. Act of the Oireachtas. Retrieved from Irish Statute Book.
- ^ Local Government Act 1998, s. 10: Amendment of section 20 of Act of 1994 (No. 16 of 1998, s. 10). Enacted on 29 May 1998. Act of the Oireachtas. Retrieved from Irish Statute Book.
External links
- Official website
- irishelectionliterature


