Part of the 1985 Irish local elections
1985 Galway County Council election
|
| ← 1979 | 20 June 1985 | 1991 → |
|
All 30 seats on Galway County Council |
|---|
| | First party | Second party | Third party | | | | | | | Party | Fianna Fáil | Fine Gael | Sinn Féin | | Seats won | 17 | 9 | 1 | | Seat change | +2 | -2 | -1 |
| | | Fourth party | | | | | | | Party | Independent | | | Seats won | 3 | | | Seat change | +1 | | |
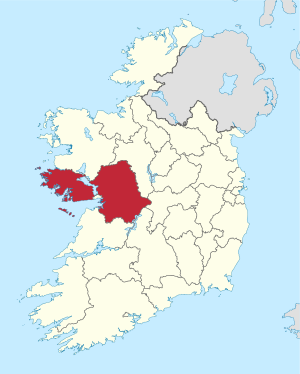 Map showing the area of Galway County Council |
| | Council control after election
Fianna Fail
| |
An election to Galway County Council took place on 20 June 1985 as part of that year's Irish local elections. 30 councillors were elected from five local electoral areas (LEAs) for a five-year term of office on the electoral system of proportional representation by means of the single transferable vote (PR-STV). This term was extended for a further year, to 1991.[1]
Results by party
| Party | Seats | ± | First Pref. votes | FPv% | ±% |
| | Fianna Fáil | 17 | +2 | 32,716 | 54.47 | |
| | Fine Gael | 9 | -2 | 16,828 | 28.02 | |
| | Sinn Féin | 1 | -1 | 2,682 | 4.47 | |
| | Independent | 3 | +1 | 7,190 | 11.97 | |
| | Labour | 0 | -1 | 124 | 0.21 | |
| Totals | 30 | -1 | 60,059 | 100.00 | — |
Results by local electoral area
Ballinasloe
Ballinasloe: 5 seats | Party | Candidate | FPv% | Count |
| 1 | 2 | 3 | 4 | 5 | 6 | 7 | 8 |
| | Fianna Fáil | Michael P. Kitt TD | | 2,368 | | | | | | | |
| | Fianna Fáil | Joe Callanan* | | 1,812 | 2,087 | | | | | | |
| | Fine Gael | Michael Mullins | | 1,634 | 1,667 | 1,689 | 1,809 | 1,836 | 2,159 | | |
| | Independent | Joe Brennan* | | 1,359 | 1,382 | 1,389 | 1,449 | 1,475 | 1,588 | 1,619 | 1,836 |
| | Fianna Fáil | James Joyce* | | 1,181 | 1,227 | 1,292 | 1,304 | 1,516 | 1,577 | 1,587 | 2,044 |
| | Fine Gael | Michael Conneely | | 714 | 730 | 737 | 768 | 864 | 958 | 1,168 | 1,196 |
| | Fianna Fáil | Pat O'Sullivan | | 587 | 636 | 696 | 738 | 870 | 899 | 910 | |
| | Fine Gael | Liam Naughton | | 575 | 581 | 583 | 676 | 682 | | | |
| | Fianna Fáil | Peter Conroy | | 430 | 499 | 586 | 593 | | | | |
| | Fine Gael | Sean Og Hurley | | 395 | 403 | 405 | | | | | |
| Electorate: 15,563 Valid: 11,055 (72.15%) Spoilt: 173 Quota: 1,843 Turnout: 11,228 |
Connemara
Connemara: 5 seats | Party | Candidate | FPv% | Count |
| 1 | 2 | 3 | 4 | 5 | 6 | 7 | 8 |
| | Fianna Fáil | Nicholas O'Connor* | | 1,842 | | | | | | | |
| | Fine Gael | John Mannion Jnr* | | 1,297 | 1,300 | 1,312 | 1,468 | 1,488 | 1,959 | | |
| | Fianna Fáil | Michael O Moráin* | | 1,042 | 1,201 | 1,205 | 1,270 | 1,334 | 1,350 | 1,367 | 1,567 |
| | Fianna Fáil | Tom Welby Snr* | | 1,005 | 1,016 | 1,026 | 1,030 | 1,034 | 1,158 | 1,216 | 1,534 |
| | Fianna Fáil | Gerald Bartley* | | 967 | 987 | 990 | 992 | 1,002 | 1,014 | 1,033 | 1,208 |
| | Independent | Peadar Ó Tuathail | | 803 | 864 | 900 | 936 | 1,204 | 1,220 | 1,256 | 1,303 |
| | Fianna Fáil | Éamon Ó Cuív | | 799 | 826 | 849 | 855 | 862 | 885 | 915 | |
| | Fine Gael | Paddy Clancy | | 596 | 597 | 609 | 686 | 695 | | | |
| | Fine Gael | Eamonn Moylette | | 373 | 376 | 380 | | | | | |
| | Independent | Noel Mac Donnchadha | | 368 | 385 | 405 | 428 | | | | |
| | Independent | Seosadh Ó Maolaidh | | 114 | 116 | | | | | | |
| | Independent | Christopher Walsh | | 18 | 18 | | | | | | |
| Electorate: 15,670 Valid: 9,224 (59.85%) Spoilt: 154 Quota: 1,538 Turnout: 9,378 |
Galway
Galway- 6 seats | Party | Candidate | FPv% | Count |
| 1 | 2 | 3 | 4 | 5 | 6 |
| | Fianna Fáil | Sen. Mark Killilea Jnr* | | 1,917 | | | | | |
| | Fianna Fáil | Bobby Molloy TD* | | 1,776 | | | | | |
| | Fine Gael | Padraig McCormack* | | 1,027 | 1,404 | | | | |
| | Sinn Féin | Paddy Ruane* | | 1,157 | 1,208 | 1,231 | 1,282 | 1,301 | 1,303 |
| | Fianna Fáil | Paddy McHugh | | 1,153 | 1,419 | | | | |
| | Fine Gael | Jarlath McDonagh | | 966 | 1,002 | 1,016 | 1,053 | 1,392 | 1,392 |
| | Fianna Fáil | John Molloy | | 791 | 905 | 1,197 | 1,238 | 1,301 | 1,317 |
| | Fine Gael | Liam MacCana | | 405 | 413 | 435 | 532 | | |
| | Workers' Party | Colm Ó Donnchadha | | 271 | 275 | 299 | | | |
| Electorate: 17,220 Valid: 9,803 (57.55%) Spoilt: 107 Quota: 1,401 Turnout: 9,910 |
Loughrea
Loughrea: 7 seats | Party | Candidate | FPv% | Count |
| 1 | 2 | 3 | 4 | 5 | 6 | 7 | 8 | 9 | 10 | 11 | 12 |
| | Fianna Fáil | Frank Fahey TD* | | 2,389 | | | | | | | | | | | |
| | Fianna Fáil | Michael (Stroke) Fahy* | | 2,147 | | | | | | | | | | | |
| | Fine Gael | Sen. Ulick Burke | | 2,132 | | | | | | | | | | | |
| | Fianna Fáil | Noel Treacy TD | | 1,635 | 1,708 | 1,727 | 1,729 | 1,736 | 1,750 | 1,785 | 1,829 | 2,033 | | | |
| | Fianna Fáil | Tony Murphy* | | 1,112 | 1,161 | 1,182 | 1,187 | 1,189 | 1,198 | 1,247 | 1,250 | 1,278 | 1,363 | 1,368 | |
| | Fianna Fáil | Eddie Haverty* | | 992 | 1,069 | 1,087 | 1,089 | 1,097 | 1,112 | 1,139 | 1,294 | 1,372 | 1,411 | 1,420 | 1,705 |
| | Fianna Fáil | Matt Loughnane | | 950 | 1,027 | 1,058 | 1,061 | 1,067 | 1,091 | 1,113 | 1,156 | 1,320 | 1,372 | 1,387 | 1,803 |
| | Fine Gael | Martin Lynch* | | 854 | 859 | 863 | 876 | 886 | 896 | 916 | 1,014 | 1,097 | 1,486 | 1,488 | 1,772 |
| | Independent | Norman Morgan | | 771 | 776 | 778 | 786 | 799 | 827 | 865 | 931 | | | | |
| | Fine Gael | Enda O'Rourke | | 760 | 769 | 775 | 831 | 834 | 869 | 874 | 974 | 1,043 | | | |
| | Fine Gael | Joe Lambert | | 759 | 821 | 851 | 857 | 896 | 967 | 1,070 | 1,293 | 1,412 | 1,703 | 1,705 | 1,778 |
| | Fine Gael | Jimmy McClearn | | 747 | 748 | 748 | 751 | 793 | 796 | 801 | | | | | |
| | Sinn Féin | Michael Loughrey | | 380 | 398 | 405 | 409 | 410 | 436 | | | | | | | | |
| | Workers' Party | Stan McEoin | | 246 | 257 | 265 | 285 | 286 | | | | | | | |
| | Labour | Peter O'Driscoll | | 124 | 126 | 127 | | | | | | | | | |
| Electorate: 22,507 Valid: 15,998 (71.81%) Spoilt: 165 Quota: 2,000 Turnout: 16,163 |
Tuam
Tuam: 7 seats | Party | Candidate | FPv% | Count |
| 1 | 2 | 3 | 4 | 5 | 6 | 7 | 8 | 9 | 10 |
| | Independent | Joe Burke* | | 2,438 | | | | | | | | | |
| | Fianna Fáil | Thomas Hussey | | 1,960 | | | | | | | | | |
| | Fianna Fáil | Patrick Finnegan* | | 1,533 | 1,646 | 1,724 | 1,742 | 1,984 | | | | | |
| | Fine Gael | Michael Ryan* | | 1,350 | 1,406 | 1,414 | 1,523 | 1,546 | 1,549 | 1,868 | | | |
| | Sinn Féin | Frank Glynn* | | 1,145 | 1,292 | 1,308 | 1,349 | 1,479 | 1,503 | 1,575 | 1,587 | 1,666 | 1,915 |
| | Fine Gael | Tiernan Walsh | | 974 | 998 | 1,009 | 1,054 | 1,066 | 1,068 | 1,199 | 1,293 | 1,468 | 1,548 |
| | Fianna Fáil | Peter Raftery | | 954 | 960 | 988 | 991 | 1,039 | 1,094 | 1,123 | 1,125 | 1,321 | 1,325 |
| | Fianna Fáil | Michael Dunne | | 818 | 858 | 884 | 897 | 957 | 1,043 | 1,078 | 1,084 | 1,232 | 1,319 |
| | Independent | Gerard Rushe | | 742 | 757 | 761 | 771 | 782 | 783 | 828 | 833 | | |
| | Independent | Jarlath Keane | | 577 | 730 | 738 | 808 | 822 | 824 | 837 | 838 | 869 | |
| | Fine Gael | Jim Mannion | | 566 | 582 | 589 | 682 | 696 | 697 | | | | |
| | Fianna Fáil | Clare Kilgarriff-Fitzgerald | | 556 | 584 | 610 | 630 | | | | | | |
| | Fine Gael | Niall Joyce | | 364 | 456 | 458 | | | | | | | |
| Electorate: 22,507 Valid: 13,979 (71.3%) Spoilt: 181 Quota: 1,748 Turnout: 14,160 |
References
- ^ Local Elections (Specification of Local Election Year) Order 1990 (S.I. No. 104 of 1990). Signed on 30 April 1990. Statutory Instrument of the Government of Ireland. Retrieved from Irish Statute Book.
External links
- Official website[permanent dead link]
- Irishelectionliterature
- Department of the Environment, Ireland (28 January 2010). "Local elections, 1985 : election results and transfer of votes in respect of each county, and county borough council : and election statistics relating to all local authorities" (PDF). Department of the Environment. Retrieved 28 October 2019.


