Part of the 1999 Irish local elections
1999 Kilkenny County Council election
|
|
All 26 seats to Kilkenny County Council |
|---|
| | First party | Second party | Third party | | | | | | | Party | Fianna Fáil | Fine Gael | Labour | | Seats won | 12 | 11 | 1 | | Seat change | 0 | +1 | -3 |
| | | Fourth party | | | | | | | Party | Independent | | | Seats won | 2 | | | Seat change | +2 | | |
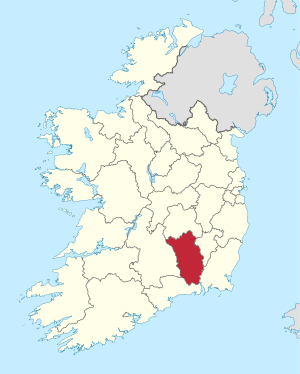 Map showing the area of Kilkenny County Council |
Council control before election
Fine Gael
Labour Party
| Council control after election
Fianna Fáil
Independents
| |
An election to Kilkenny County Council took place on 10 June 1999 as part of that year's Irish local elections. 26 councillors were elected from five local electoral areas on the system of proportional representation by means of the single transferable vote (PR-STV) for a five-year term of office.
Results by party
| Party | Seats | ± | First Pref. votes | FPv% | ±% |
| | Fianna Fáil | 12 | 0 | 14,216 | 43.46 | |
| | Fine Gael | 11 | +1 | 10,855 | 33.18 | |
| | Labour | 1 | -3 | 3,601 | 11.01 | |
| | Independent | 2 | +2 | 2,055 | 6.28 | |
| Totals | 26 | 0 | 32,714 | 100.00 | — |
Results by local electoral area
Ballyragget
Ballyragget - 5 seats | Party | Candidate | FPv% | Count |
| 1 | 2 | 3 | 4 | 5 | 6 |
| | Fine Gael | Mary Hilda Cavanagh* | 22.21 | 1,431 | | | | | |
| | Fine Gael | Dan Brennan* | 12.68 | 817 | 859 | 876 | 908 | 957 | 962 |
| | Labour | Maurice Shortall | 12.23 | 788 | 802 | 844 | 892 | 940 | 944 |
| | Fianna Fáil | Pat Millea* | 11.66 | 751 | 812 | 945 | 1,359 | | |
| | Fianna Fáil | Martin Carroll | 11.61 | 748 | 756 | 965 | 1,087 | | |
| | Fine Gael | Catherine Connery | 10.32 | 665 | 753 | 873 | 917 | 953 | 957 |
| | Fianna Fáil | Brigid Murphy* | 10.00 | 644 | 664 | | | | |
| | Fianna Fáil | Seán Warren | 9.28 | 598 | 722 | 804 | | | |
| Electorate: 10,997 Valid: 6,442 (58.58%) Spoilt: 105 Quota: 1,074 Turnout: 6,547 (59.53%) |
Callan
Callan - 3 seats | Party | Candidate | FPv% | Count |
| 1 | 2 |
| | Fianna Fáil | Liam Aylward TD | 30.68 | 1,282 | |
| | Fianna Fáil | James Brett* | 25.59 | 1,069 | |
| | Fine Gael | Tom Maher* | 23.53 | 983 | 1,079 |
| | Fine Gael | Philip Brennan | 16.28 | 680 | 786 |
| | Green | Phyllida Clarke | 3.93 | 164 | 199 |
| Electorate: 7,426 Valid: 4,178 (56.26%) Spoilt: 61 Quota: 1,045 Turnout: 4,239 (57.08%) |
Kilkenny
Kilkenny - 7 seats | Party | Candidate | FPv% | Count |
| 1 | 2 | 3 | 4 | 5 | 6 | 7 | 8 | 9 |
| | Fianna Fáil | John McGuinness TD* | 19.41 | 1,678 | | | | | | | | |
| | Fianna Fáil | John Coonan | 13.34 | 1,153 | | | | | | | | |
| | Labour | Joe Cody* | 12.65 | 1,093 | | | | | | | | |
| | Fine Gael | Phil Hogan TD* | 12.07 | 1,043 | 1,104 | | | | | | | |
| | Fine Gael | Paul Cuddihy | 9.27 | 801 | 852 | 861 | 867 | 869 | 928 | 979 | 991 | 1,150 |
| | Fianna Fáil | Michael Lanigan, Jnr | 9.00 | 778 | 1,041 | 1,066 | 1,071 | 1,072 | 1,114 | | | |
| | Fine Gael | Pat Crotty | 6.09 | 526 | 561 | 568 | 572 | 573 | 597 | 654 | 660 | 766 |
| | Independent | Teresa Mullen | 6.00 | 519 | 556 | 563 | 565 | 566 | 596 | 698 | 702 | 865 |
| | Labour | Tony Patterson | 4.81 | 416 | 473 | 480 | 483 | 489 | 545 | 625 | 634 | |
| | Fianna Fáil | John Eardly | 4.27 | 369 | 445 | 459 | 461 | 462 | 492 | | | |
| | Progressive Democrats | John Murphy | 3.09 | 267 | 284 | 287 | 288 | 288 | | | | |
| Electorate: 17,083 Valid: 8,643 (50.59%) Spoilt: 134 Quota: 1,081 Turnout: 8,777 (51.38%) |
Piltown
Piltown - 6 seats | Party | Candidate | FPv% | Count |
| 1 | 2 | 3 | 4 | 5 | 6 | 7 | 8 |
| | Fianna Fáil | Bobby Aylward* | 16.79 | 1,105 | | | | | | | |
| | Fine Gael | Dick Dowling* | 13.69 | 901 | 916 | 936 | 962 | | | | |
| | Fine Gael | John Paul Phelan | 10.91 | 718 | 734 | 757 | 771 | 777 | 831 | 850 | 910 |
| | Fianna Fáil | Cora Long | 10.58 | 696 | 726 | 731 | 745 | 746 | 782 | 811 | 968 |
| | Fine Gael | Pat Dunphy | 10.35 | 681 | 685 | 701 | 718 | 723 | 734 | 760 | 790 |
| | Fianna Fáil | Ann Blackmore* | 9.47 | 623 | 670 | 678 | 696 | 697 | 730 | 742 | 895 |
| | Labour | Tomás Breathnach* | 7.45 | 566 | 572 | 581 | 615 | 617 | 624 | 705 | 752 |
| | Fianna Fáil | Tommy Knox | 6.81 | 448 | 461 | 465 | 479 | 481 | 605 | 669 | |
| | Workers' Party | Davy Walsh | 4.09 | 269 | 272 | 276 | 313 | 316 | 325 | | |
| | Fianna Fáil | Richard Fitzgerald | 4.09 | 269 | 292 | 300 | 306 | 307 | | | |
| | Green | Afra Cronin | 2.98 | 196 | 197 | 198 | | | | | |
| | Independent | Peter McDonald | 1.64 | 108 | 113 | | | | | | |
| Electorate: 12,251 Valid: 6,580 (53.71%) Spoilt: 112 Quota: 941 Turnout: 6,692 (54.62%) |
Thomastown
Thomastown - 5 seats | Party | Candidate | FPv% | Count |
| 1 | 2 | 3 | 4 | 5 | 6 | 7 | 8 |
| | Independent | Dixie Doyle | 15.07 | 922 | 943 | 947 | 982 | 1,004 | 1,073 | | |
| | Fianna Fáil | Tom Brennan | 11.46 | 701 | 709 | 713 | 766 | 776 | 971 | 987 | 1,032 |
| | Fine Gael | Billy Ireland* | 11.13 | 681 | 703 | 708 | 731 | 828 | 872 | 876 | 926 |
| | Fine Gael | Andy Cotterell* | 10.48 | 641 | 675 | 681 | 705 | 819 | 868 | 881 | 954 |
| | Fianna Fáil | Joan Murphy | 8.34 | 510 | 513 | 551 | 586 | 651 | 775 | 786 | 1,078 |
| | Independent | Denis Coady | 8.27 | 506 | 535 | 584 | 597 | 689 | 713 | 714 | |
| | Fianna Fáil | Kevin Fennelly* | 8.16 | 499 | 510 | 513 | 588 | 602 | | | |
| | Labour | Michael O'Brien* | 7.75 | 474 | 518 | 626 | 657 | 679 | 725 | 733 | 825 |
| | Fine Gael | John Meaney | 6.54 | 400 | 414 | 459 | 465 | | | | |
| | Fianna Fáil | Paddy Daly | 4.69 | 287 | 304 | 306 | | | | | |
| | Labour | Thomas Prendergast | 4.32 | 264 | 275 | | | | | | |
| | Green | Kevin Knox | 3.79 | 232 | | | | | | | |
| Electorate: 10,825 Valid: 6,117 (56.51%) Spoilt: 95 Quota: 1,020 Turnout: 6,212 (57.31%) |
External links


