Election of the members of the House of Representatives
1963 Dutch general election
|
| ← 1959 | 15 May 1963 | 1967 → |
|
All 150 seats in the House of Representatives
76 seats needed for a majority |
| Turnout | 95.1% ( 0.5 pp) 0.5 pp) |
|---|
| Party | Leader | % | Seats | +/– | | KVP | Wim de Kort | 31.9% | 50 | +1 | | PvdA | Anne Vondeling | 28.0% | 43 | −5 | | VVD | Edzo Toxopeus | 10.3% | 16 | −3 | | ARP | Barend Biesheuvel | 8.7% | 13 | −1 | | CHU | Henk Beernink | 8.6% | 13 | +1 | | PSP | Henk Lankhorst | 3.0% | 4 | +2 | | CPN | Paul de Groot | 2.8% | 4 | +1 | | SGP | Cornelius van Dis | 2.3% | 3 | 0 | | BP | Hendrik Koekoek | 2.1% | 3 | +3 | | GPV | Piet Jongeling | 0.7% | 1 | +1 | This lists parties that won seats. See the complete results below. 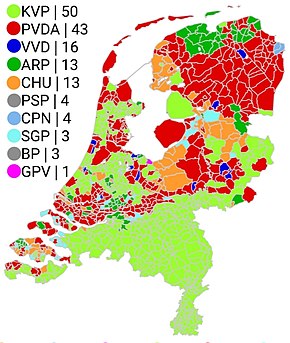 Seats |
|
General elections were held in the Netherlands on 15 May 1963.[1] The Catholic People's Party (KVP) remained the largest party, winning 50 of the 150 seats in the House of Representatives.[2]
The elections led to a four-party coalition government initially consisting of the KVP, People's Party for Freedom and Democracy, Anti-Revolutionary Party (ARP) and Christian Historical Union. In 1965 this coalition was replaced by one consisting of the KVP, Labour Party and ARP.
Results
 |
|---|
| Party | Votes | % | Seats | +/– |
|---|
| Catholic People's Party | 1,995,348 | 31.88 | 50 | +1 |
| Labour Party | 1,753,025 | 28.01 | 43 | –5 |
| People's Party for Freedom and Democracy | 643,820 | 10.29 | 16 | –3 |
| Anti-Revolutionary Party | 545,718 | 8.72 | 13 | –1 |
| Christian Historical Union | 536,782 | 8.58 | 13 | +1 |
| Pacifist Socialist Party | 189,370 | 3.03 | 4 | +2 |
| Communist Party of the Netherlands | 173,322 | 2.77 | 4 | +1 |
| Reformed Political Party | 143,549 | 2.29 | 3 | 0 |
| Farmers' Party | 133,210 | 2.13 | 3 | +3 |
| Reformed Political League | 46,324 | 0.74 | 1 | +1 |
| Economic Appeal Party | 37,554 | 0.60 | 0 | New |
| Liberal State Party | 22,353 | 0.36 | 0 | New |
| Liberal Union–Safe Traffic and 100,100 Houses Each Year | 21,048 | 0.34 | 0 | New |
| New Democratic Party | 13,064 | 0.21 | 0 | New |
| Christian National People's Party | 1,823 | 0.03 | 0 | New |
| Grol List | 876 | 0.01 | 0 | New |
| People's Referendum | 819 | 0.01 | 0 | New |
| Total | 6,258,005 | 100.00 | 150 | 0 |
|
| Valid votes | 6,258,005 | 97.49 | |
|---|
| Invalid/blank votes | 161,441 | 2.51 | |
|---|
| Total votes | 6,419,446 | 100.00 | |
|---|
| Registered voters/turnout | 6,746,362 | 95.15 | |
|---|
| Source: Kiesraad |
By province
Results by province[3] | Province | KVP | PvdA | VVD | ARP | CHU | PSP | CPN | SGP | BP | GPV | Others |
| | | | | | | | | | |
 Drenthe Drenthe | 7.6 | 40.1 | 15.5 | 14.7 | 11.6 | 1.8 | 2.0 | 0.5 | 4.2 | 1.3 | 0.7 |
 Friesland Friesland | 7.3 | 35.0 | 8.1 | 21.8 | 16.3 | 3.9 | 2.1 | 0.8 | 2.8 | 1.2 | 0.7 |
 Gelderland Gelderland | 31.9 | 27.4 | 9.3 | 7.9 | 12.8 | 1.3 | 0.8 | 3.7 | 3.2 | 0.5 | 0.8 |
 Groningen Groningen | 6.5 | 38.1 | 13.1 | 16.2 | 10.1 | 3.6 | 5.0 | 0.4 | 2.2 | 3.7 | 1.0 |
 Limburg Limburg | 77.5 | 12.9 | 2.3 | 0.9 | 0.8 | 0.5 | 1.2 | 0.1 | 2.3 | 0.1 | 1.4 |
 North Brabant North Brabant | 71.9 | 13.5 | 4.1 | 2.4 | 2.4 | 0.7 | 0.5 | 0.6 | 2.1 | 0.1 | 1.6 |
 North Holland North Holland | 24.2 | 30.3 | 13.7 | 7.1 | 5.5 | 6.4 | 7.2 | 0.7 | 2.0 | 0.3 | 2.6 |
 Overijssel Overijssel | 28.1 | 27.8 | 8.0 | 9.5 | 13.0 | 2.0 | 2.5 | 2.9 | 3.2 | 2.1 | 0.9 |
 South Holland South Holland | 19.2 | 34.3 | 13.2 | 10.5 | 9.7 | 3.6 | 2.4 | 4.0 | 1.2 | 0.5 | 1.5 |
 Southern IJsselmeer Polders Southern IJsselmeer Polders | 21.4 | 30.3 | 6.6 | 15.9 | 16.7 | 2.1 | 1.1 | 1.7 | 1.0 | 2.8 | 0.4 |
 Utrecht Utrecht | 25.8 | 27.5 | 12.3 | 11.0 | 11.7 | 2.6 | 1.2 | 3.6 | 1.7 | 1.1 | 1.6 |
 Zeeland Zeeland | 20.8 | 27.5 | 9.3 | 11.8 | 15.8 | 1.0 | 0.6 | 9.2 | 2.1 | 0.9 | 1.1 |
References
- ^ Dieter Nohlen & Philip Stöver (2010) Elections in Europe: A data handbook, p1396 ISBN 978-3-8329-5609-7
- ^ Nohlen & Stöver, p1413
- ^ "Tweede Kamer 15 mei 1963". Kiesraad (in Dutch). Retrieved 28 November 2023.

 0.5 pp)

 Drenthe
  Friesland
  Gelderland
  Groningen
  Limburg
  North Brabant
  North Holland
  Overijssel
  South Holland
  Southern IJsselmeer Polders
  Utrecht
  Zeeland


